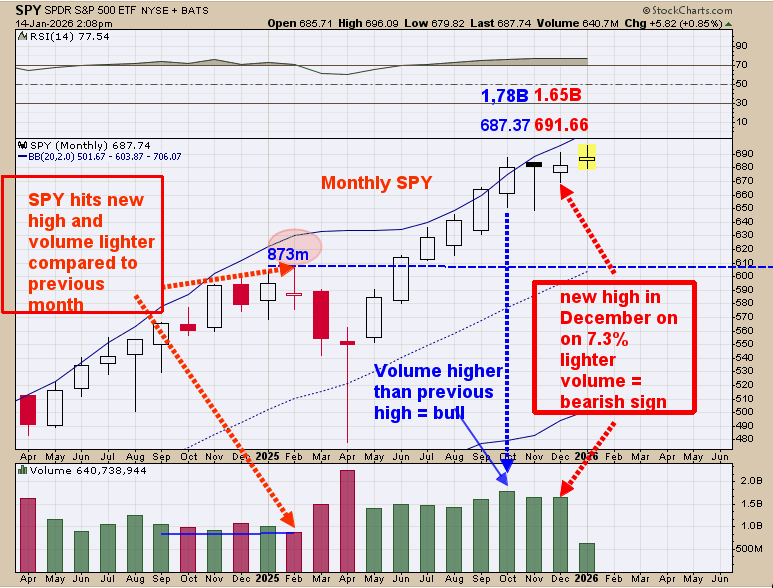
Above is the monthly . Back in February 2025 the SPX tested all times high and volume dropped over 10% compared to the previous high and then closed below the previous high (noted on chart). That condition suggested the market did not have enough energy to move higher which produced the decline into the April low. December tested the previous high of October on 7.3% lighter volume.
")
Ideally for a bearish sign the volume should decrease by 10% or more. So the 7.3% decrease in volume is a bearish sign its not a sell signal. Month of January is near half over, If volume can say near 1.65 billion this month the market will have energy to move higher; if volume drop to 149 billion or less, that will suggests upside energy is decreasing and a sell signal could develop. This is the bigger picture for the market; Page two shows the smaller picture which remains bullish. Staying long for now.
 / SPDR S&P 500 ETF Overlay (ARMSNYA & SPY – Daily Chart)")
The bottom window is the 3-day average of the TRIN which closed at 1.30, next higher window is the 2-day average of the TRIN which closed at 1.32; next higher is the 5-day TRIN which closed at 1.25 and top window is the 10-day average of the TRIN which closed at 1.17. TRIN closes of 1.20 and higher shows there is panic in the market and panic only forms near lows. All moving averages of the Trin closed in or near bullish levels suggesting this rally has further to go. We shaded in vertical pink areas where at least the 2- and 3-day TRIN reached above 1.20 We also shaded in pink on the chart horizontally (second window down from top) the price level where panic formed in the past which is a support area. Staying long the SPX for now.
")
The above chart is a short term view for . The bottom window daily cumulative advance/decline for GDX; next higher window is the daily cumulative up down volume for GDX. Top window is the daily GDX. Up trend in GDX is intact when both indicators remain above their mid Bollinger bands. We noted with blue squares where there are right now, and both are at the upper Bollinger bands and not near their mid Bollinger bands. Uptrend in GDX appears intact. Long GDX on 9/29/25 at 75.76.
5 Stocks Our Experts Predict Could Double In the Next Year
By submitting your email, you'll also get a free pivot & flow membership. A free daily market overview. You can unsubscribe at any time.