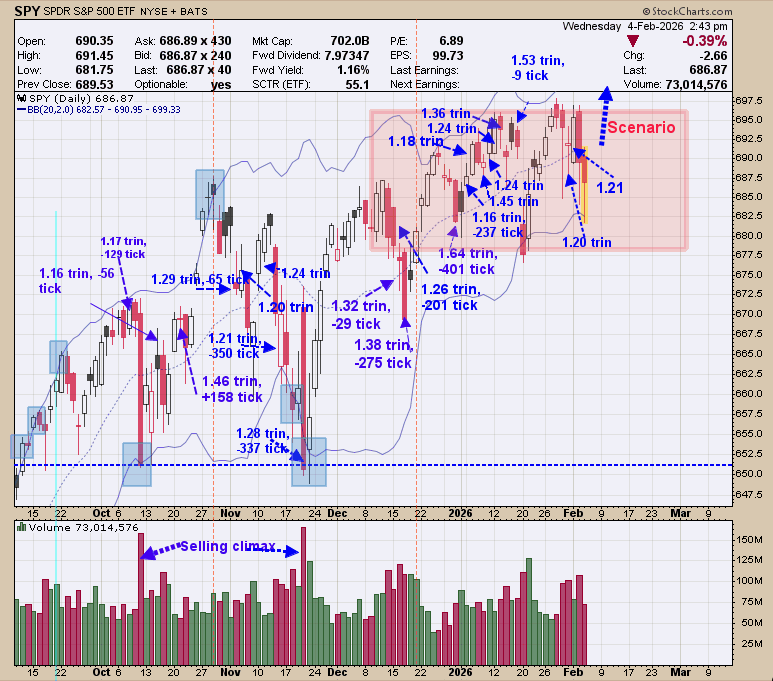
Last Friday the TRIN closed at 1.20 and tick closed at -217, which is a bullish combination, suggesting a low in the market forming on the same day of the reading to as late as two days later which would be today. Seems this rule is changing gradually, and the market may extend its bottoming process to three days. Monday the TRIN closed at 1.21 and the tick at -9 which is bullish and adds to the bullish short term picture.

We shaded in pink where the TRIN closed near 1.20 and higher which suggests a support area and current prices on in this region. May see rally into mid month. Seasonality turns modestly bearish mid Month and we will see what the picture looks like then.

The second window up from the bottom is the weekly /TLT ratio and next higher window is the weekly SPX. The weekly SPX/VIX ratio has been trending down since late December and the SPX, more or less has gone sideways, which is divergence. This sideways action can last a while before the market may react. The trin closes have been showing panic suggesting a short term low is near (page 1) and another rally short term is possible. If the SPX manages a new high and the weekly SPX/VIX ratio fails to reach a new high a large divergence would develop on the SPX similar to the one in December to February of 2025. Staying long the SPX for now.”

The above chart looks at the bigger picture for . Bottom window is the weekly GDX and next higher window is the weekly Bullish percent index for the Gold Miners index/GDX ratio. The bullish percent index for the Gold Miners index measures the percentage of stocks that are on Point and Figure buy signal in the Gold Miners index. The top window is the 10 period RSI for this ratio. Lows in GDX are found when the 10 period RSI for this ratio falls below 25 (current reading is 23.01). We noted with blue lines the times when the RSI for this ratio closed below 25. The previous 13 cases going back to 2014 where all near lows for GDX (not counting current setup). The current RSI setup at 23.01 suggests intermediate term GDX is setup for a low here. Longer term trend remains bullish.
5 Stocks Our Experts Predict Could Double In the Next Year
By submitting your email, you'll also get a free pivot & flow membership. A free daily market overview. You can unsubscribe at any time.