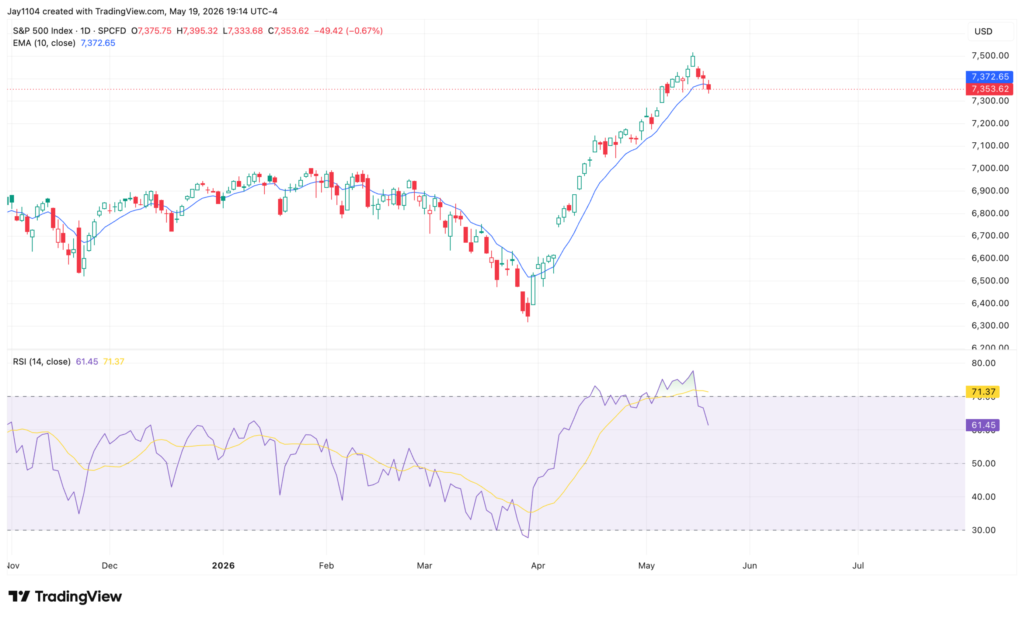
The finished the day lower by about 65 bps and closed below its 10-day exponential moving average. It is not a deal-breaker for the bulls, but it is notable, given that this level acted as strong resistance in May and solid support in April. One day does not make a trend, but another day or two below the moving average could.
Rates rose again on Tuesday, with the easily closing at its highest level since 2007. One thing that stands out is that the yield is now trading above its upper Bollinger Band, while the RSI has climbed above 70. That suggests rates are becoming overextended and may be due for either a period of sideways consolidation or a pullback toward the 20-day moving average near 5%.
That said, rates have been trading closely with oil, so if oil continues higher, it will be difficult for yields not to keep rising as well, even in an overbought condition.
As of now, at least on a closing basis, it appears that oil has broken out of a symmetrical triangle/diamond pattern. The distance from the top to the bottom of the pattern measures roughly $30 per barrel, and when that range is projected from the breakout point, it suggests could climb toward $130.
5 Stocks Our Experts Predict Could Double In the Next Year
By submitting your email, you'll also get a free pivot & flow membership. A free daily market overview. You can unsubscribe at any time.