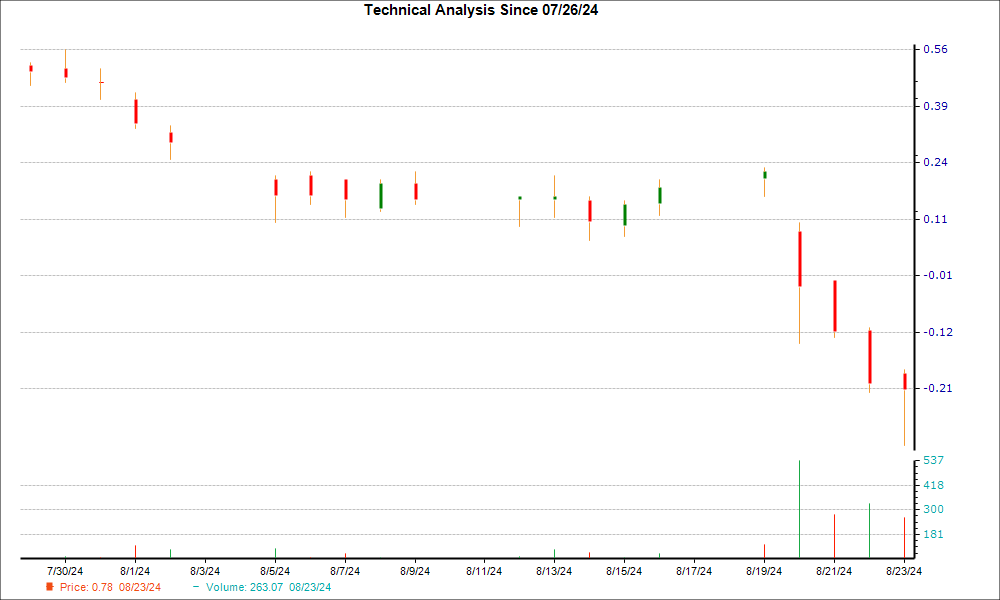
The recent price trend for Workhorse Group (NASDAQ: WKHS) has been rather bleak, with the stock experiencing a significant 33.6% decline over the past week. However, a glimmer of hope emerged with the formation of a hammer chart pattern during its last trading session. This pattern suggests a possible trend reversal on the horizon, as bullish forces seem to be gaining traction, potentially leading the stock to find support.
While the technical significance of a hammer pattern signals a potential bottoming-out process with a hint of selling pressure exhaustion, the optimistic outlook from Wall Street analysts regarding the future earnings of this company specializing in trucks and drones further bolsters the case for a turnaround.

Decoding Hammer Chart and Trading Strategies
The hammer chart pattern is a widely recognized signal in candlestick charting. It is characterized by a small candle body, with a notable difference between the opening and closing prices, accompanied by an extended lower wick or vertical line. The length of the lower wick being at least twice that of the real body creates the distinctive ‘hammer’ appearance.
During a downtrend, when bears dominate the market, a stock typically opens lower than the previous close and further trends downwards. However, on the day the hammer pattern emerges, amidst the prevailing downtrend, the stock hits a new low. Subsequently, a surge in buying interest emerges, resulting in the stock rebounding to close near or slightly above its opening price.
When observed at the bottom of a downtrend, the hammer pattern indicates a potential shift in control from bears to bulls, suggesting a forthcoming trend reversal.
Hammer candles can manifest across various timeframes and are utilized by investors with diverse investment horizons, from short-term traders to long-term holders.
While the hammer pattern can provide valuable insights, its effectiveness is amplified when used in conjunction with other bullish indicators, considering its reliance on chart positioning.
Factors Enabling the WKHS Potential Reversal
The recent upsurge in earnings estimate revisions for WKHS serves as a promising fundamental indicator. Historical data indicates a strong correlation between earnings estimate trends and short-term stock price movements.
Notably, over the past month, the consensus EPS estimate for the current year has surged by 22.5%. This uptick signifies a consensus among sell-side analysts covering WKHS regarding an anticipated improvement in the company’s earnings performance.
Furthermore, with a Zacks Rank #2 (Buy) currently assigned to WKHS, the stock falls within the top 20% of the more than 4,000 stocks ranked based on earnings estimate revisions and EPS surprises by Zacks. Stocks with Zacks Rank #1 or 2 typically exhibit market outperformance.
The Zacks Rank has proved to be a reliable indicator for identifying shifts in a company’s prospects. Therefore, the Zacks Rank of 2 for Workhorse Group offers a strong fundamental signal pointing towards a potential uptick in its future performance.


