Savvy investors understand that successful investing is about finding an edge, exploiting that edge over a large series of trades, and managing risk when the edge does not work in your favor. In other words, the best investors are also the best risk managers.
Today, we will discuss two market bottom signals with perfect track records. Before we get into things, it’s important to note that past performance does not guarantee future results, and each market is unique. That said, each of the following indicators has large enough data sets and robust enough results to make them worth exploring at the very least.
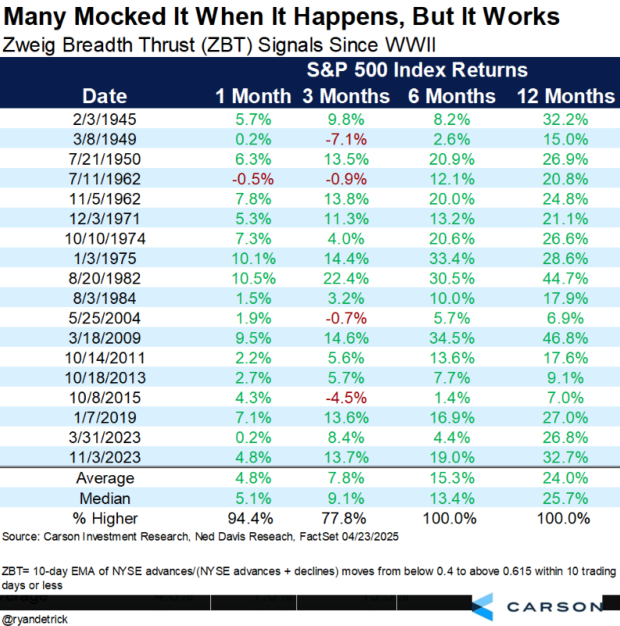
Zweig Breadth Thrust: A Perfect Track Record
The Zweig Breadth Thrust Indicator is one such data point that can provide investors with a significant edge. How significant? Though rare, a Zweig Breadth Thrust has been triggered 18 times since World War 2. In that time, following a successful ZBT trigger, S&P 500 Index returns have never been lower six months and a year forward!

Image Source: Carson Investment Research, Ned Davis Research, @ryandetrick
What is a Zweig Breadth Thrust?
Created by legendary investor Marty Zweig, a Zweig Breadth Thrust measures an abrupt change in breadth (the number of stocks rising) after a period of decline and can be calculated as follows:

Image Source: Zacks Investment Research
Think of a ZBT like as an adrenaline shot for Wall Street bulls. While the initial jolt of energy is brief, historical data sets show that it is meaningful in the context of calling major market bottoms.
Extreme Volatility Spikes Above 50 Lead to Market Bottoms
“Short-term volatility is greatest at turning points and diminishes as a trend becomes established.” ~ George Soros
The Volatility Index, or VIX, measures Wall Street’s expectations of short-term volatility of the S&P 500, calculated from the prices of S&P 500 Index options. In plain language, the VIX measures investor fear. Hedge funds and institutional investors will pile into the VIX when they fear a “black swan” event is on the horizon.
Since 1990, when the VIX has spiked above 50 (the top 1% of historical readings), the S&P 500 Index has been higher over the next 1,2,3,4, and 5 years later (75 instances). In addition to the perfect track record, stocks have also seen above average returns in most instances.

Image Source: TradingView
Watch “First Mover” Stocks
From an individual stock perspective, investors should look for stocks that resisted the bear market mayhem the best – these are likely to lead when the market firms up. A few examples include Netflix (NFLX), Uber Technologies (UBER), IonQ (IONQ), Oklo (OKLO), and Carvana (CVNA).
Bottom Line
While no indicator can guarantee future market results, the Zweig Breadth Thrust’s historical consistency and extreme VIX spikes above 50 offer compelling data for savvy investors to consider.
Zacks Names #1 Semiconductor Stock
It’s only 1/9,000th the size of NVIDIA which skyrocketed more than +800% since we recommended it. NVIDIA is still strong, but our new top chip stock has much more room to boom.
With strong earnings growth and an expanding customer base, it’s positioned to feed the rampant demand for Artificial Intelligence, Machine Learning, and Internet of Things. Global semiconductor manufacturing is projected to explode from $452 billion in 2021 to $803 billion by 2028.
See This Stock Now for Free >>
Netflix, Inc. (NFLX) : Free Stock Analysis Report
Carvana Co. (CVNA) : Free Stock Analysis Report
Uber Technologies, Inc. (UBER) : Free Stock Analysis Report
IonQ, Inc. (IONQ) : Free Stock Analysis Report
Oklo Inc. (OKLO) : Free Stock Analysis Report
This article originally published on Zacks Investment Research (zacks.com).
5 Stocks Our Experts Predict Could Double In the Next Year
By submitting your email, you'll also get a free pivot & flow membership. A free daily market overview. You can unsubscribe at any time.